European Data Project
An independent monitor of European security, assembled from open data. Every figure below is published by someone else. This site collects them, keeps them current, and states plainly what each one does and does not measure.
How to read this site
- verified minimum
- A count confirmed case by case. The real total is at least this, and usually higher.
- estimate
- A figure its source calls an estimate or projection. Later editions may revise it.
- stale
- Newer data should exist by now, or its fetcher is failing. The panel says which, and when it last updated.
- media attention
- How much news coverage a topic got, not how many events happened. A spike means more reporting.
Under every chart, the panel says what it measures and what it does not. Downloaded files carry the same notes.
Ukraine–Russia war
The war produces very little verified data in real time. Casualty figures are verified minimums published a month in arrears. Displacement figures are administrative records. Only air raid alerts are live. Read each panel with its own caveat rather than as one picture.
Civilian casualties
Source: UN HRMMU
Civilians killed and injured in Ukraine, verified by UN human rights monitors.
These are verified minimums, not estimates of the true toll. HRMMU states actual figures are likely considerably higher — verification lags, and access to occupied areas is limited. HRMMU also revises earlier months as verification continues: July 2026 was first published as 437 killed and later reported as 448, so a month's figure can rise after it first appears.
Updates: monthly, published mid-following-month
Under temporary protection in the EU
Source: Eurostat (migr_asytpsm)
People from Ukraine holding active temporary protection status across EU states at month end.
A stock, not arrivals. It falls when status is withdrawn or people return, so a decline does not by itself mean fewer people are leaving Ukraine.
Updates: monthly
Oblasts under air raid alert
Source: alerts.in.ua
How many Ukrainian oblasts had an active air raid alert at the moment of the last fetch.
A snapshot, not a daily total. Alerts start and end within minutes, so this undercounts unless fetched frequently. Requires an API token; blank until set.
Updates: real time
Host countries
Source: Eurostat (migr_asytpsm)
Where Ukrainians under temporary protection are hosted, at the latest month.
Reflects where people registered, not necessarily where they now live — onward movement within the EU is not fully captured.
Updates: monthly
Strike and shelling coverage
Source: GDELT (GKG)
Share of English-language news headlines GDELT saw each day that report strikes, shelling or drone and missile attacks in Ukraine.
Media attention, not events. A spike means coverage rose — which may reflect a major attack, or simply a news cycle. Never read this as a count of incidents.
Updates: every 15 minutes
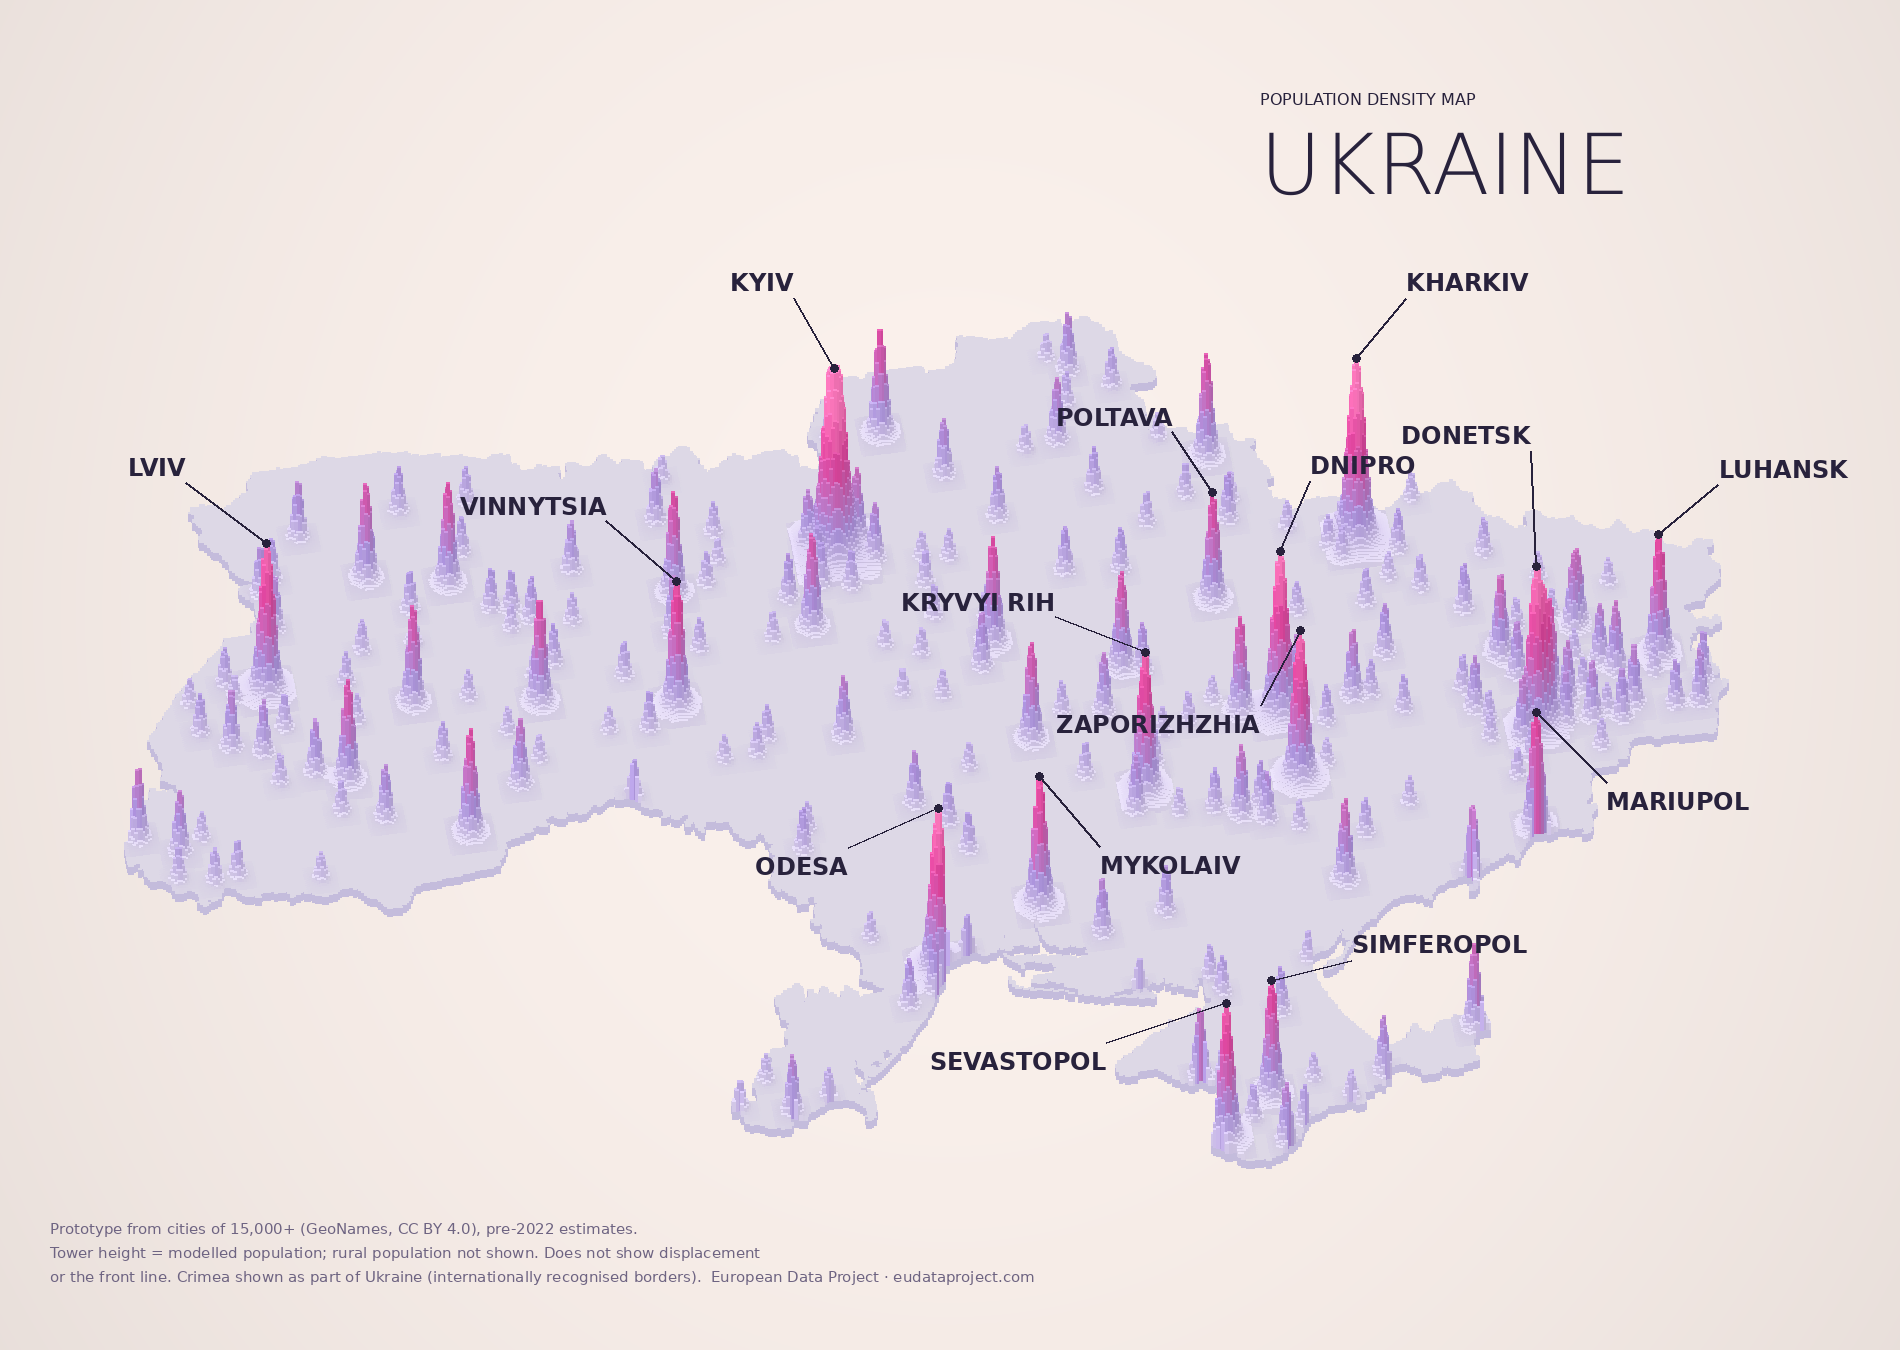
Where Ukraine’s people lived
The war set off the largest displacement in Europe since the Second World War: millions of people left the country, and millions more moved within it. The towers show where the population was concentrated before the invasion. Kyiv stands alone; Kharkiv, Dnipro, Donetsk, Zaporizhzhia, Mariupol and Odesa form the eastern and southern chain nearest the fighting, which is where most of the movement began.
A prototype built from cities of 15,000 or more (GeoNames, CC BY 4.0), using pre-2022 estimates. Tower height is modelled from city population, and rural population is not shown. It does not show displacement, who lives where today, or the front line. Crimea is drawn as part of Ukraine, within its internationally recognised borders. For current counts of refugees and displaced people, see the UNHCR operational data portal and the temporary protection panels above.
EU accession
Accession is the EU's principal instrument toward Kyiv and Chişinău, which makes its progress a security indicator rather than a bureaucratic one. Ukraine and Moldova opened their first cluster in June 2026, after a Hungarian veto lasting more than two years was lifted, and a second in July. Four clusters remain unopened for both.
Negotiating chapters, of 33
Source: Council of the EU
How far each candidate has progressed through the 33 negotiating chapters: provisionally closed, opened but not closed, and not yet opened.
Provisional closure is not final — under the negotiating principles, nothing is settled until agreement is reached on all chapters. Chapter count also says nothing about difficulty: the rule-of-law chapters are far harder than the rest and are deliberately closed last. Target dates and Commission roadmaps (published 4 Nov 2026) are plans, not stage changes: a country's own accession target is not a forecast, and this chart moves only on Council decisions at an Accession Conference.
Updates: after each accession conference
Acquis alignment score
Source: Bruegel (Dabrowski & Louro)
Each candidate's average preparedness across the 33 negotiating chapters in the latest Commission report, from Bruegel's coding of the Commission's wording on a 0-100 scale.
A third-party reading of narrative reports, not an official score: the Commission publishes no number. A plain average treats every chapter as equal, though the rule-of-law chapters weigh far more in practice.
Updates: annual
Canada is neither a member nor a candidate, and the EU treaties have no “associate member” category. On 16 September 2026 Commission President von der Leyen proposed that Canada become the EU's first associate member. By the Montreal summit on 29–30 October the phrase had reportedly been dropped from the joint statement; the two sides instead committed to define a “closer association” by the 2027 summit. Carney has ruled out full membership and described the aim as the deepest possible partnership short of accession.
This is a political track, not an accession process, so it has no chapter counts and does not appear in the charts above. What it would involve (trade, defence, programmes, any voice in EU institutions) has not been decided.
Energy
The most closely watched European security indicator since 2022, and the only one here that updates daily. Storage operators report what is held in every EU underground site each gas day; the aggregate arrives about a day later. Read the percentage and the volume together — the first is what gets quoted, the second is what actually has to last the winter.
EU gas storage, % full
Source: GIE AGSI+
How full EU underground gas storage is, as a share of working capacity, reported daily by the storage operators themselves.
A percentage of capacity, not a volume. Capacity itself changes as sites are added or mothballed, so a flat line can hide a shrinking denominator — read it alongside the TWh series rather than on its own. The EU storage regulation sets a filling target for 1 November, but the level has been revised more than once; check the current figure before quoting one.
Updates: daily, about one day behind
Gas in storage
Source: GIE AGSI+
Absolute energy held in EU underground storage, in terawatt-hours.
The volume that matters for supply, as opposed to the percentage that gets quoted. Winter draw and summer injection dominate the shape, so compare against the same week in previous years rather than against last month.
Updates: daily, about one day behind
Storage by country, % full
Source: GIE AGSI+
How full each country's storage is on the latest reported gas day.
Percentages are not comparable as supply: a state with small capacity can sit at 100% and still hold a fraction of what a larger neighbour holds at 60%. Ukraine is included — its storage is the largest in Europe and a security question in its own right.
Updates: daily
Injection and withdrawal
Source: GIE AGSI+
Gas flowing into storage against gas drawn out, across the EU.
The crossover points mark the start and end of the heating season. A withdrawal spike in mild weather, or injection failing to start on time, is the signal worth noticing — not the absolute level.
Updates: daily
Caspian gas into Europe
Source: ENTSOG; outlines Natural Earth
Where gas from Azerbaijan's Shah Deniz field crosses into the EU along the Southern Gas Corridor (SCP, TANAP, TAP), and how much of each border pipe is in use. Dots are the three EU border points with live data: Kipoi (Türkiye to Greece), Strandzha (Türkiye to Bulgaria, where TurkStream gas arrives) and Melendugno (TAP into Italy). Tap or hover a dot for its latest reading. Thin dotted lines are other gas pipelines (Blue Stream, TurkStream, Greenstream, Transmed, the Greece-Bulgaria interconnector) and the dashed line is the BTC oil pipeline, drawn for context only. Drag the map to pan and use the buttons to zoom, or choose Balkans for a close-up of the crossings.
A border reading is gas passing a point, not who supplied a country: swaps and contracts can differ, and Kipoi gas is not all Azerbaijani. ENTSOG does not cover Azerbaijan, Georgia or Türkiye's own pipelines, so the route there is drawn but carries no data. Pipeline routes are traced from published maps through their main waypoints and simplified, so they show roughly where each line runs, not its surveyed path. Grey means no reading, never zero. Capacity is the operator's published technical capacity, which is updated irregularly.
Updates: daily, about one day behind
Daily flow at the border points
Source: ENTSOG Transparency Platform
Physical gas flow per gas day at the three EU border points on the Southern Gas Corridor and TurkStream routes, for the last 60 days.
Figures for the latest days are provisional and ENTSOG can revise them. Strandzha sums its two measurement points.
Updates: daily, about one day behind
Day-ahead electricity prices
Source: Energy-Charts (Fraunhofer ISE); Bundesnetzagentur | SMARD.de, CC BY 4.0
The average day-ahead wholesale electricity price each day for six large markets, over the last 60 days.
Wholesale auction prices, not what households pay, which adds network charges, taxes and supplier margins. Italy is its northern zone, Germany includes Luxembourg. A daily average hides the evening peaks that drive many of the costs.
Updates: daily
Electricity prices by country
Source: Energy-Charts (Fraunhofer ISE); Bundesnetzagentur | SMARD.de, CC BY 4.0
The average day-ahead wholesale price on each country's latest day, highest first. Gaps between neighbours show where cross-border lines are full.
One bidding zone stands for each country (northern Italy, western Denmark, southern Norway and Sweden), so a national average could differ. Wholesale, not retail, prices.
Updates: daily
Conflict and ceasefires
No live count of ceasefire violations exists in Europe today. The OSCE Special Monitoring Mission recorded them directly until its mandate ended on 31 March 2022, when Russia blocked renewal. What follows is a coverage proxy, useful for spotting that something happened, not for counting what happened.
Ceasefire violation coverage
Source: GDELT (GKG)
Share of English-language news headlines GDELT saw each day that report ceasefire violations or truce breaches, anywhere.
Media attention, not verified violations. The OSCE monitoring mission that once counted these directly closed in March 2022; no equivalent live count exists.
Updates: every 15 minutes
Ceasefire talk versus breach reports
Source: GDELT (GKG)
Two daily shares of English-language headlines: all ceasefire or truce stories, and the subset that report a violation or breach.
Media attention, not events. When the first line rises alone, the story is usually negotiation; when both rise together, coverage is of a truce under strain. Neither line counts violations, and the OSCE no longer does either.
Updates: every 15 minutes
Where ceasefire stories are set
Source: GDELT (GKG)
Countries named in English-language ceasefire or truce headlines over the last 14 days.
A headline counts for every country its story mentions, so a mediator or sponsor such as the US or Qatar is counted alongside the countries at war. Counts come from a sample of GDELT's 15-minute files and show relative attention, not totals.
Updates: every 15 minutes
Ceasefire coverage against strike coverage
Source: GDELT (GKG)
The ceasefire-violation share and the Ukraine strike-and-shelling share, each scaled so its own 90-day average is 100, so the two can be compared on one axis.
Compares shape, not size: the raw shares differ by an order of magnitude. A ceasefire line that follows strikes with a lag suggests truce news reacting to the fighting; it does not show cause. Both are media attention, not events.
Updates: every 15 minutes
Migration
Administrative counts from Eurostat, supplied by national interior ministries. Slower than the news but actually countable: these are decisions and applications recorded by governments, not estimates.
Asylum applications
Source: Eurostat (migr_asyappctzm)
First-time and repeat asylum applications lodged across the EU, all citizenships.
Applications, not arrivals or approvals. Ukrainians mostly use temporary protection instead, so they barely appear here.
Updates: monthly
Applications by state
Source: Eurostat (migr_asyappctzm)
Which European states (EU plus EFTA) received the most asylum applications over the period.
Where applications were lodged, which is shaped by route and border geography as much as by destination preference.
Updates: monthly
Entry refusals at the external border
Source: Eurostat (migr_eirfs)
Non-EU nationals refused entry at the EU's external border.
Counts refusal decisions, not people — one person refused repeatedly is counted each time.
Updates: annual
Cyber
The hardest domain to measure. Most incidents are never disclosed, and those that are skew heavily towards large organisations. Everything here except the incident snapshot is news coverage, which shows what was reported and not what happened. The snapshot is hand-compiled from press reports and says so.
Cyberattack coverage
Source: GDELT (GKG)
Share of English-language news headlines GDELT saw each day about cyberattacks or ransomware, in stories GDELT places in Europe.
Media attention, not incidents. Most breaches are never reported publicly, and large victims generate far more coverage than small ones.
Updates: every 15 minutes
Refrigeration attacks on European supermarkets
Early on 2 November 2026, refrigeration and freezer systems at supermarkets in several European countries were reported to have been driven to dangerous temperatures, spoiling stock. Reports name Belgium, Luxembourg, Ireland, Sweden, Italy, Portugal, Estonia, Finland and the Netherlands, though accounts differ on the list. It follows an attack on hundreds of French stores on 12 October.
Supermarket and retail hack coverage
Source: GDELT (GKG)
Share of English-language news headlines GDELT saw each day that link a hack or cyberattack to supermarkets, grocers, refrigeration or named European grocery chains.
Media attention, not damage. It rises on the day an attack is reported, and shows nothing about how many stores or how much food was affected. The counts of stores in the chart beside it come from press reports, not from this series.
Updates: every 15 minutes
Stores reported affected, by retailer
Source: press reports of 2 November 2026 (Yahoo Finance UK; Interesting Engineering)
- CarrefourBelgium · of about 700 stores15
- Supervalu (Musgrave)Ireland13
- Intermarché (Mousquetaires)Portugal7
- CoopSweden · another report says seven6
- ColruytBelgium and Luxembourg5
- DelhaizeLuxembourg · outlets4
- CoopItaly · at least; Sicily4
A hand-compiled snapshot, not a data feed. Counts are the lowest figure given in reports and will change as retailers finish checking. Ahold Delhaize, ICA, Kesko, IKEA and Estonian and Dutch outlets were named without a count and are left out. Sources disagree in places: one counts seven Coop stores in Sweden, another six.
What is and is not known
- Vendor. Several retailers said affected stores used refrigeration controllers from the Danish maker Danfoss. Security researchers at Claroty had earlier reported vulnerabilities in Danfoss controllers, and the company released a software update. A Belgian refrigeration contractor, Sabcobel, said some of its systems had not yet been upgraded, and Coop Sweden said its affected stores were on a 4G link rather than the newer 5G one.
- Attribution. No group has claimed responsibility and investigators have not said who is behind it. It is not established that the French attack in October and this one used the same flaw or the same actor.
- Response. Belgian federal prosecutors opened an investigation. The EU agriculture commissioner, Christophe Hansen, called the incidents a deliberate attempt to disrupt the food supply chain. Italy planned a cybersecurity meeting with its intelligence services.
- Reading the coverage chart. The series is rebuilt from GDELT’s 15-minute files and can take a day or two to fill back to mid-October, so it may look sparse at first.
Reports were still developing on 2 November and the numbers above may be revised. Sources: Yahoo Finance UK, Interesting Engineering.
Infrastructure attack coverage
Source: GDELT (GKG)
Share of English-language news headlines GDELT saw each day that link a hack or cyberattack to energy, water, hospitals, transport, telecoms or pipelines, in stories GDELT places in Europe.
Media attention, not incidents. The keyword match is broad, so a headline about a cyberattack on a hospital group and one about an energy company's customer data both count.
Updates: every 15 minutes
Ransomware coverage
Source: GDELT (GKG)
Share of English-language news headlines GDELT saw each day that mention ransomware, in stories GDELT places in Europe.
Media attention, not incidents. A single large victim can dominate a week. Most ransomware cases are never made public.
Updates: every 15 minutes
Defence
Two clocks on the same subject. Official expenditure is accurate and roughly a year late. News coverage moves immediately but proves nothing. Shown together, the gap between them is the story.
Defence expenditure
Source: Eurostat (gov_10a_exp, COFOG GF02)
General government spending on defence as a share of GDP.
Annual and lagging — typically a year or more behind. Uses the COFOG definition, which differs from NATO's, so figures will not match NATO published numbers. Shows the EU27 aggregate; if Eurostat stops publishing that geo code this panel goes empty rather than silently averaging countries.
Updates: annual
Defence spending coverage
Source: GDELT (GKG)
Share of English-language news headlines GDELT saw each day about European or NATO defence spending.
Media attention, not budget movement. Leads the official figures above by a year or more, which is the point of showing both.
Updates: every 15 minutes
NATO members' defence spending
Source: NATO, Defence Expenditure of NATO Countries (June 2024)
Each ally's defence spending as a share of GDP in 2024, on NATO's own definition. Dotted lines mark the long-standing 2% guideline and the 3.5% core-defence share of the 5% by 2035 commitment made in 2025.
The 2024 figures are NATO's estimates from June 2024 and later editions have revised them. The 3.5% target is a 2035 goal, not a current threshold. NATO definitions differ from Eurostat's, so these will not match the EU series.
Updates: annual
Defence spending since 2014
Source: NATO, Defence Expenditure of NATO Countries (June 2024)
Defence spending as a share of GDP, 2014 to 2024, for the European and Canadian allies together, the United States, Germany and Poland.
2023 and 2024 are estimates. Aggregates include members from the year they joined (Finland 2023, Sweden 2024). A share of GDP can rise because spending grew or because the economy shrank.
Updates: annual
Equipment share of defence spending
Source: NATO, Defence Expenditure of NATO Countries (June 2024)
The share of each ally's defence budget spent on major equipment and the research and development tied to it. NATO's guideline is at least 20%.
Single-year shares swing with large purchases, so one high year does not show a lasting shift. Estimates for 2024, from NATO's June 2024 report.
Updates: annual
Defence spending per person
Source: NATO, Defence Expenditure of NATO Countries (June 2024)
Defence spending divided by population, in constant 2015 US dollars, for 2024.
Constant dollars at 2015 prices and exchange rates, so the figures are lower than today's money and compare countries fairly rather than showing current budgets. 2024 values are estimates.
Updates: annual
Biggest increases since 2014
Source: NATO, Defence Expenditure of NATO Countries (June 2024)
How many percentage points of GDP each ally's defence spending rose between 2014 and 2024.
A change in share, not in money. Countries that started from a low base show large jumps for modest budgets, and the 2024 end point is an estimate.
Updates: annual
Military spending, latest year (SIPRI)
Source: SIPRI Military Expenditure Database, via Our World in Data
Military spending as a share of GDP in 2025 for European countries, the United States, Canada and Russia, on SIPRI's definition. Ukraine, at about 40% of GDP, is left out so the scale stays readable.
SIPRI counts more than NATO does, such as paramilitary forces, and uses its own GDP figures, so allies' shares will differ from the NATO charts above. Russia's figure is SIPRI's estimate.
Updates: annual
Military spending since 2000 (SIPRI)
Source: SIPRI Military Expenditure Database, via Our World in Data
Military spending as a share of GDP since 2000 for Russia, the United States, Poland, the United Kingdom, France and Germany.
A share of GDP can rise because spending grew or because the economy shrank. SIPRI revises earlier years when new data arrives.
Updates: annual
Distance to the 3.5% target
Source: SIPRI Military Expenditure Database, via Our World in Data
How many percentage points of GDP each NATO member would have to add to reach the 3.5% core-defence target agreed in 2025, from SIPRI's 2025 spending. The twenty biggest gaps are shown; members already at 3.5% have none.
The target is for 2035, and NATO counts spending on its own definition, not SIPRI's, so a member can sit nearer or further than shown. A gap in points of GDP is not a gap in money: the same points are a far larger sum for a big economy than for a small one.
Updates: annual
Elections
Votes that can move security policy: who sits in the office that commands the armed forces, and who writes the defence budget. This is a calendar, not a forecast. It lists only elections whose exact date has been called or is fixed by law, each linked to the source it was checked against, because there is no free feed of European election dates reliable enough to publish unchecked.
Vote share by party stance on the EU
Source: Chapel Hill Expert Survey 2024 (Rovny et al.), vote shares from ParlGov and the survey team
How each country's vote at its last national election before the October 2024 survey split between parties that country experts rate in favour of the EU (5 or more on a 7-point scale), mixed (above 3 and below 5) and opposed (3 or less). Parties not rated, independents and small parties make up the rest.
The expert ratings are the survey's, not this site's, and a party's position can differ from its government's. Elections held after late 2024, such as Germany in 2025, are not included. The election year each country's bar refers to is in the hover text.
Updates: each survey wave, about every five years
Pro-EU vote and military spending
Source: Chapel Hill Expert Survey 2024; SIPRI Military Expenditure Database via Our World in Data (2025)
Each dot is a country: the share of its last pre-2024 national vote that went to parties rated in favour of the EU, against its military spending as a share of GDP in 2025.
An association across about thirty countries, not a cause: spending also tracks proximity to Russia and wealth. The two measures come from different years, and the vote shares predate elections after late 2024.
Updates: each survey wave; spending annual
Sources
Every series here belongs to the organisation that publishes it. Their terms govern reuse, and several require attribution.
| Source | Provides | Updates | Access |
|---|---|---|---|
| GDELT Project | News coverage volume, article feeds | 15 min | Open |
| Eurostat | Asylum, temporary protection, defence spending | Monthly, annual | Open |
| NATO | Defence expenditure by member: share of GDP, per person, equipment share | Annual | Open, from the June 2024 report |
| Energy-Charts (Fraunhofer ISE) | Day-ahead electricity prices by bidding zone, from Bundesnetzagentur | SMARD.de | Daily | Open, CC BY 4.0 |
| ENTSOG Transparency Platform | Daily gas flow at the Kipoi, Strandzha and Melendugno border points | Daily | Open, no key |
| SIPRI (via Our World in Data) | Military spending as a share of GDP, 2000 to 2025 | Annual | Open, CC BY |
| National election authorities, news agencies | Dates of upcoming national elections | As called | Hand-checked, source linked on each row |
| Chapel Hill Expert Survey | Party positions on the EU, applied to national vote shares, 31 countries | Each survey wave | Open, 2024 wave; cite Rovny et al. 2025 |
| UN HRMMU | Verified civilian casualties in Ukraine | Monthly | Manual entry |
| GIE AGSI+ | EU gas storage levels and flows | Daily | Free key |
| alerts.in.ua | Air raid alerts by oblast | Real time | Free token |
| ACLED | Georeferenced conflict events | Weekly | Free key, non-commercial |
| EuRepoC | European cyber incidents | Periodic | Manual export |
The OSCE Special Monitoring Mission to Ukraine, which recorded more than 1.5 million ceasefire violations between 2016 and 2021, closed on 31 March 2022 and publishes nothing further. No live replacement exists.
Independence
This is an independent project. It is not affiliated with, endorsed by, funded by, or connected to the European Union, the European Commission, Eurostat, or any other EU institution, body or agency. The name describes the subject matter, not the publisher. Data is drawn from those institutions’ public outputs under their own terms; that use implies no relationship.
Privacy
Web server logs record the pages requested, the time, and a truncated visitor address — the final octet of an IPv4 address, or everything after the network prefix of an IPv6 one, is discarded before the entry is written. What remains cannot identify an individual connection. Logs stay on the server that runs this site and are not shared.
Analytics, where enabled, load only after an explicit choice. Nothing is requested from any analytics provider and no cookie is set until then, declining is remembered, and a browser sending Do Not Track or Global Privacy Control is treated as having declined without being asked. A theme preference and that analytics choice are kept in local storage on your own device; neither is transmitted.
About
The European Data Project is built and run independently by one person. It is not affiliated with any government, EU institution or funder.
Support
The European Data Project is built and run by one person, on a home server. There are no ads, no paywall and no sponsors, and nothing here is for sale. If it is useful to you, a coffee helps keep it running.
Buy me a coffee
A one-off contribution covers the domain, the electricity and disks for the server, and the hours spent checking every figure against the organisation that publishes it.
buymeacoffee.com/stephenstirling (opens in a new tab)Payment is handled by Buy Me a Coffee; this site never sees your details. Support does not influence what is published here.